Most ecommerce chatbot statistics online cannot be traced to a dataset. The ones below can: they come from 884 real conversations across 63 stores on Vatdi over the 90 days to 15 September 2026, with test traffic excluded and the method stated. They show when shoppers ask, what they ask about, how long conversations run, how often a person is needed, where shoppers are, and how good the answers were. One properly sourced external figure is included.
Method, before the numbers
- Dataset: every conversation started on a live Vatdi store between 17 June and 15 September 2026. Internal evaluation traffic is excluded. That leaves 884 conversations across 63 stores.
- Who the stores are: small. The median store had 5 conversations in the period, 46 of the 63 stores had 10 or fewer, and the busiest single store accounts for 13.6% of the total. Read everything below as "small online stores", not the market.
- Time zone: hours are UTC, because stores span 46 countries. "Outside office hours" therefore means outside 09:00–18:00 UTC, which overstates it for some stores and understates it for others.
- Topics: bucketed by English keywords in the shopper's messages. 304 of the 884 conversations matched at least one bucket; the rest were in other languages or did not contain a bucket keyword. Topic shares are of all 884, so they are floors, not totals.
- Quality: Vatdi grades every conversation 0–10 with a model-based judge; 881 of the 884 were graded. The score is ours, and it is strict by design.
- No personal data was read for this analysis; everything is an aggregate count.
1. When shoppers ask: 39.6% outside 09:00–18:00 UTC, 17.4% at weekends
In our data, 39.6% of conversations started outside 09:00–18:00 UTC and 17.4% started on a Saturday or Sunday. The hour-by-hour distribution peaks at 09:00–11:00 UTC and has a long evening tail; the quietest hour is 22:00. Monday and Friday were the busiest weekdays; Sunday the quietest day.
2. What shoppers ask about: order status and shipping lead
Of the 884 conversations, the English-keyword buckets matched as follows. Because a conversation can hit more than one bucket and non-English conversations rarely match, treat these as minimum shares.
| Topic (keyword bucket) | Share of all 884 conversations | What it usually needs |
|---|---|---|
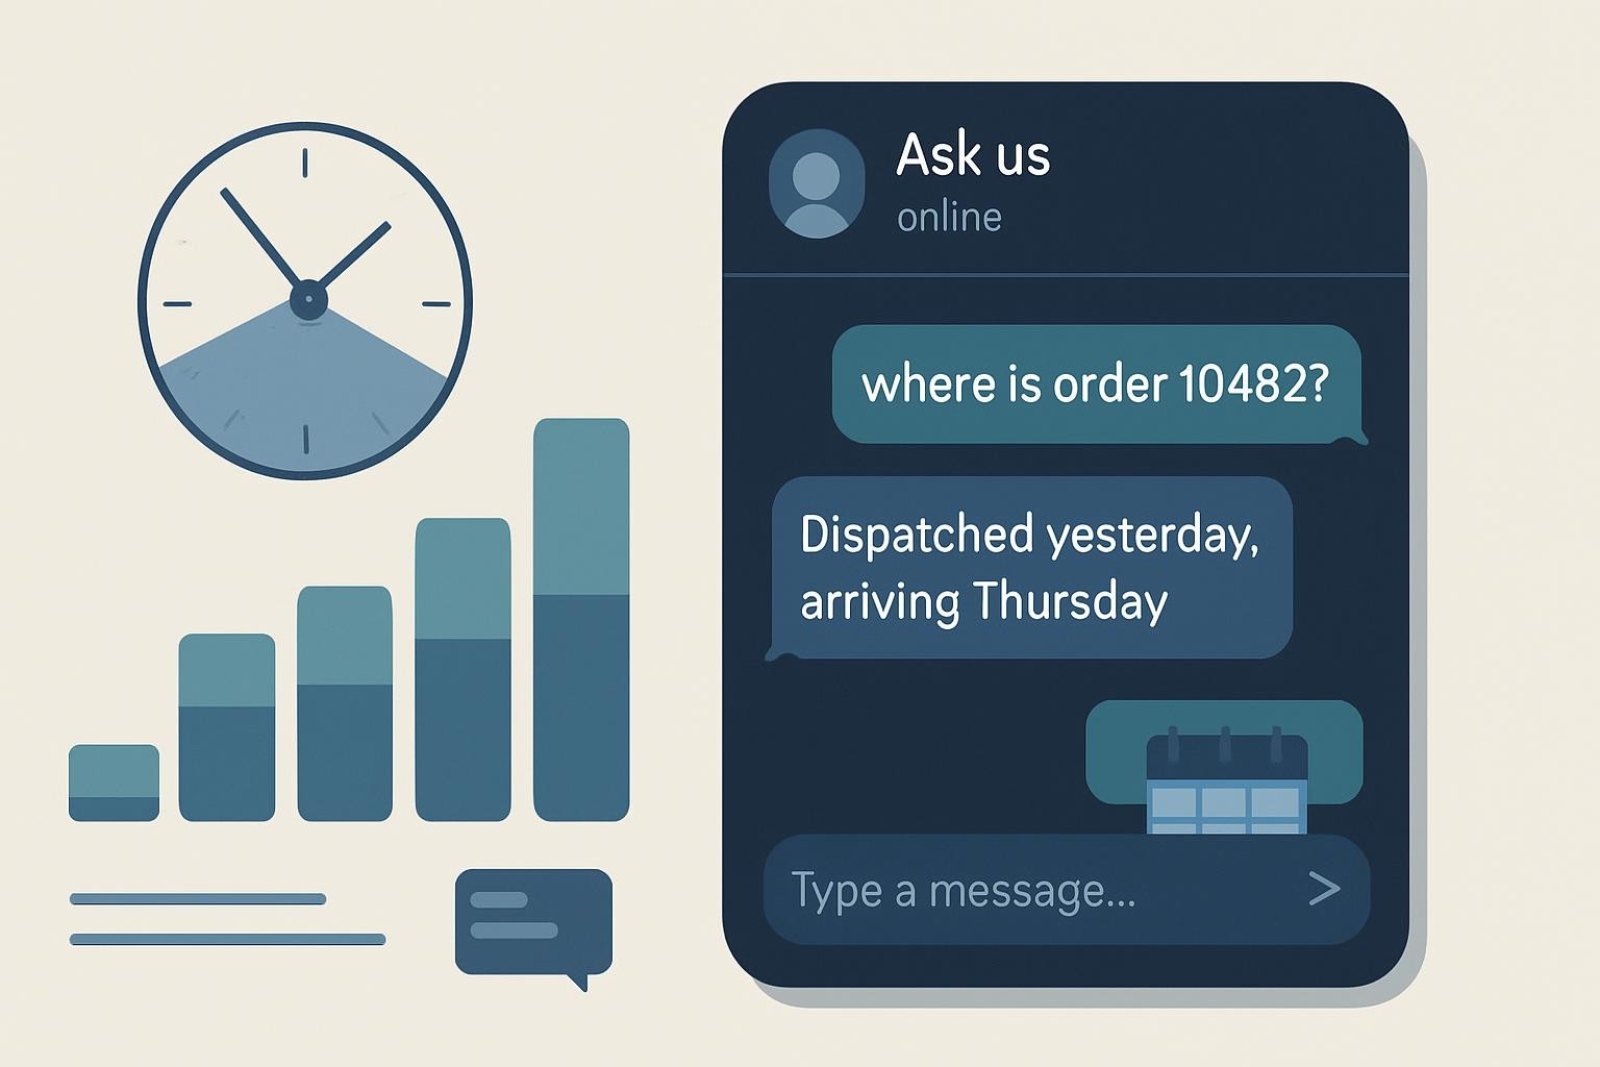
| Order status and tracking | 10.9% | Live order lookup, or a person |
| Shipping and delivery | 9.8% | A shipping-zones table on one page |
| Price and discounts | 6.6% | Catalogue prices; coupon conditions |
| Asking for a person | 6.0% | Handover rules and honest hours |
| Opening hours and location | 5.2% | A contact page the bot can quote |
| Payment | 3.3% | Payment methods FAQ |
| Returns and refunds | 1.6% | Returns page, one question per heading |
| Stock and availability | 1.6% | Catalogue sync with stock |
| Warranty and faulty items | 0.9% | Warranty page; a person for claims |
| Size, fit and compatibility | 0.8% | Product attributes as fields |
The two largest buckets, order status and shipping, are exactly the two that can be answered from data rather than judgement, which is why order tracking in chat and a clear shipping page are the first things we recommend setting up. The list of twelve recurring questions and how to prepare each is in the twelve questions shoppers ask a store chatbot.
3. How long conversations run: median two messages, 47.8% just one
Counting the shopper's own messages, the median conversation had 2 and the mean 2.73. 47.8% of conversations contained a single shopper message, 21.7% had two, 10.8% three, 6.1% four and 13.6% five or more. Two readings follow. First, the single-message majority is mostly quick questions answered in one turn, or visitors who typed and left, and the bot's first answer is therefore the whole experience for half of shoppers. Second, the 13.6% long tail is where product comparison, troubleshooting and handovers live, and where a transcript that travels to a person matters.
4. How often a person was needed: 3.8% asked, 2.3% were assigned
In our data, 3.8% of conversations (34 of 884) included a handover request, and 2.3% were assigned to a human agent. The gap between the two is the number that deserves weekly attention on any store: requests that arrived outside agent hours or were not picked up. Vatdi counts missed handovers for that reason; the rules that keep the number low are in what chatbot human handover is. The low overall rate reflects the topic mix above: most questions had an answer in the store's content or order data.
5. Where shoppers are: 46 countries, no single majority
Conversations came from 46 countries. The five largest shares were India 17.2%, the United Kingdom 12.0%, Malaysia 9.4%, the United States 8.9% and Romania 7.9%; together they are just over half, and the remaining 41 countries make up the rest. For a store owner the implication is language: with this spread, automatic language detection and translated widget labels are not a feature for "international" stores, they are the default. How that works is in how a multilingual AI chatbot actually works.
6. How often the assistant showed a product: 45.2% of conversations
In 45.2% of conversations the assistant's replies included product information (a product card or a product suggestion drawn from the synced catalogue). Combined with the topic buckets, this says that a large share of store chat is pre-purchase rather than post-purchase, which is where a chatbot affects sales: the doubt on the product page, answered with the product in front of the shopper.
7. How good the answers were: average 5.41 out of 10
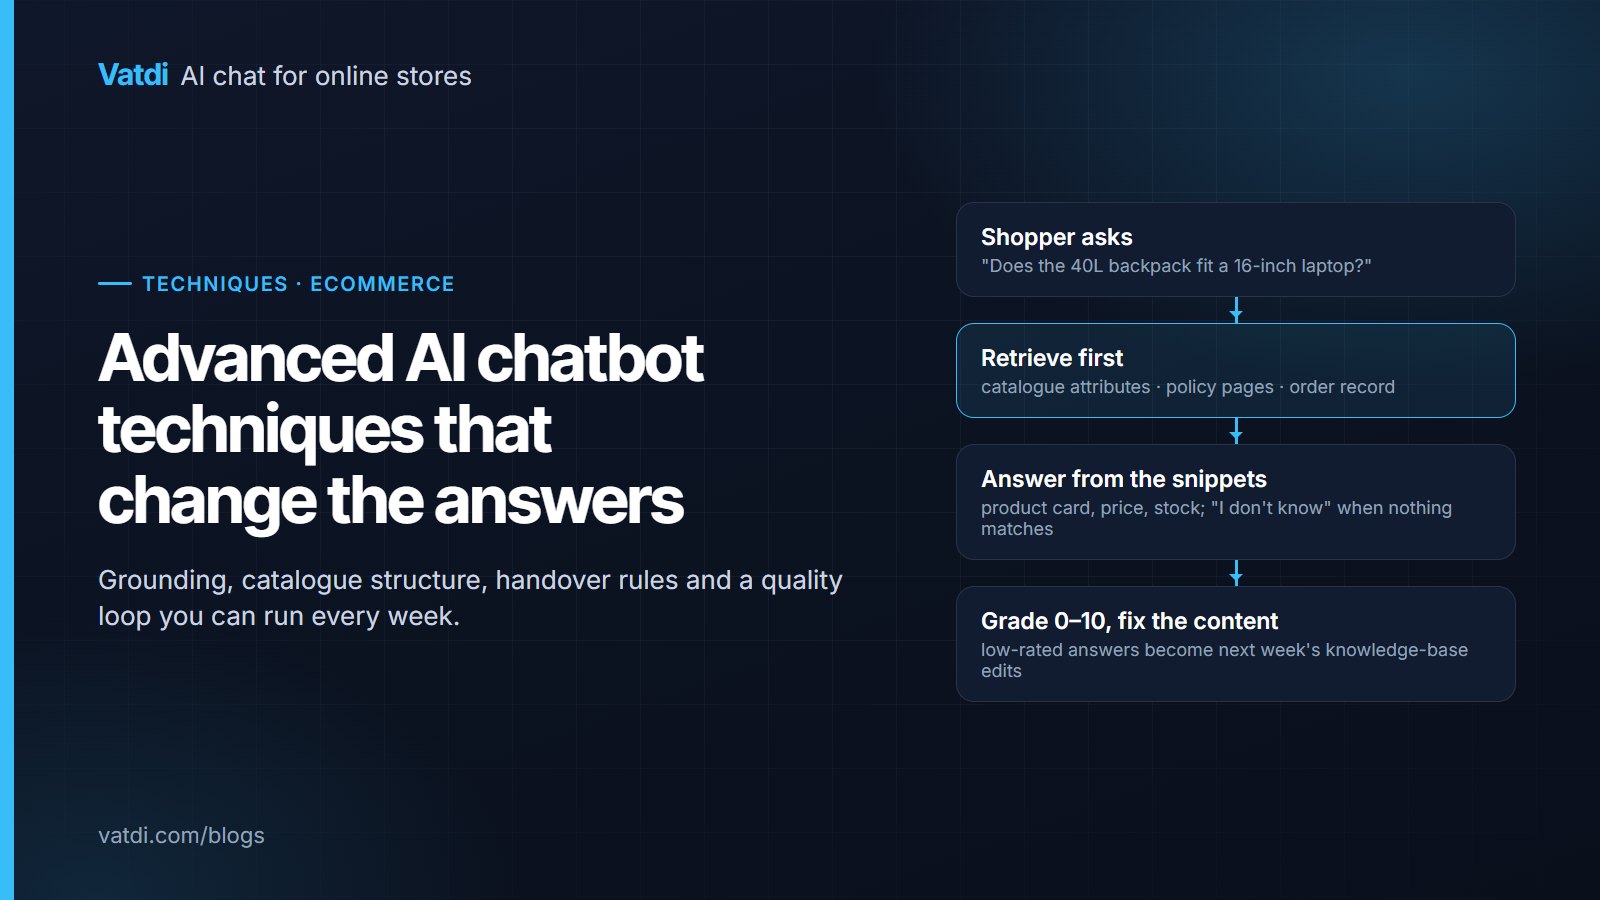
This is the number vendors do not publish. Vatdi's judge graded 881 conversations: the average was 5.41 out of 10, 34.7% scored 7 or higher, and 36.0% scored below 5. The judge is deliberately strict (a correct answer that misses a follow-up opportunity does not score well) and the stores are small, many still building their content. The judge scores the whole exchange, including whether a retrieval-based bot declined correctly when nothing matched (the approach is described in Lewis et al., 2020). In our data, low scores overwhelmingly trace to content gaps rather than model errors: a shipping question with no shipping page, a product question with the attribute missing. That is the practical point of publishing the number: the fix is in the store owner's hands, and the loop for doing it is in advanced chatbot techniques.
8. The one external statistic we consider sourced
The Baymard Institute maintains a running average of documented cart-abandonment studies; it sits at about 70% (Baymard cart abandonment rate). It is relevant here because the reasons shoppers give for abandoning overlap with the top chat topics above: shipping cost and delivery time. We cite it because the source, method and list of underlying studies are public.
Statistics we deliberately do not cite
You will find figures such as "chatbots resolve 80% of questions", "AI cuts support costs by 30%" and multi-billion-dollar savings projections repeated across vendor blogs, usually attributed to a report that either cannot be located, paywalls its method, or was itself citing another vendor. We do not use them. When a statistic has no dataset, no date and no method, it is marketing copy with a percent sign. The habit we recommend to store owners is the same one we apply to ourselves: measure your own store, and compare against your own last month.
How to produce these numbers for your own store
- Timing: conversations by hour and weekday, from your chat reports. Compare with your agent hours.
- Topics: read fifty conversations and tally them by the buckets above; it takes an hour and is more accurate than keywords.
- Length: the share of single-message conversations tells you how much rides on the first answer.
- Handover: requests versus handled; the gap is your missed-handover count.
- Quality: the grade distribution, and the content fix behind each low score.
Vatdi's reports show timing, handover and quality on every plan, including Free (pricing); the metrics worth tracking over time are in AI chatbot KPIs to track. We will re-run this analysis in a future quarter and publish the changes, method unchanged.
Frequently asked questions
Where do these ecommerce chatbot statistics come from?
From Vatdi's own production data: 884 conversations across 63 live stores between 17 June and 15 September 2026, with internal evaluation traffic excluded and only aggregate counts read. The topic shares use English keyword buckets and are floors; the quality scores are Vatdi's own 0–10 judge. The method is stated at the top of the article so you can decide how far to generalise.
Are these numbers representative of ecommerce chatbots in general?
No, and we say so. The stores are small (median five conversations in the period), spread across 46 countries, and mostly on plugin platforms. They are representative of what a small online store sees when it adds a retrieval-based chatbot, which is the audience of this blog. Larger stores and helpdesk deployments will see different topic mixes and handover rates.
Why is the average quality score only 5.41 out of 10?
Because the judge is strict and most of the stores were still building their content. A grade below 5 usually means the store's pages did not contain the answer, not that the model failed; the bot correctly said it did not know, which the judge still marks down. Publishing the number is the point: it shows what content work is worth, and it is the baseline we will compare against next quarter.
What is the most common thing shoppers ask a store chatbot?
In this dataset, order status and tracking (10.9% of all conversations by English keywords), followed by shipping and delivery (9.8%), then price and discounts (6.6%). The real shares are higher because non-English conversations rarely match the buckets. All three have answers in data rather than judgement, which is why order lookup and a shipping page are the first things to set up.
How often does a chatbot need to hand over to a human?
In our data, 3.8% of conversations included a request for a person and 2.3% were assigned to one. The rate depends on the topic mix and on how well the store's content answers the rest; a store with no returns page will see more handovers than one with a clear policy. The number to watch weekly is the gap between requests and assignments, which is your missed handovers.
Can I use these statistics in my own material?
Yes, with attribution to this article and the period and sample stated: 884 conversations, 63 stores, 17 June to 15 September 2026, Vatdi. Please keep the caveats, particularly that topic shares are keyword-based floors and that hours are UTC. We will publish an updated set with the same method in a future quarter so the figures can be compared over time.